
A new Point Elevation API from OpenTopography
Aug 17, 2026
OpenTopography is excited to announce the launch of a new Point Elevation API - a fast, lightweight service that returns the elevation for any location on Earth from our global and regional dataset collection with a single web request.
What Is the Point Elevation API?
OpenTopography has long offered an API for downloading Digital Elevation Models (DEMs): you define an area of interest, and the service returns a raster dataset covering that region. That service remains available and is ideal for applications that need terrain data over a geographic area.
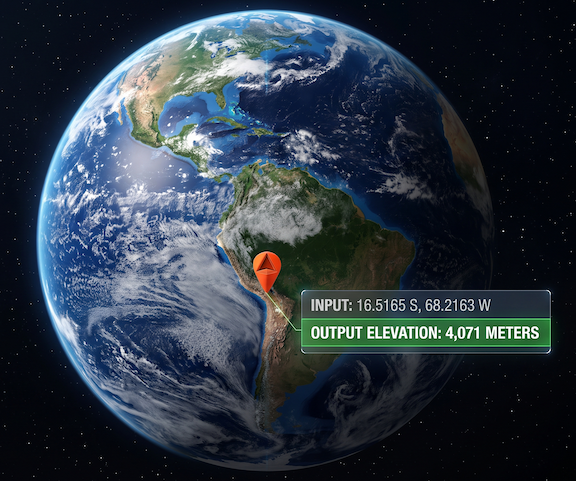
The new Point Elevation API addresses a different need. Rather than returning a grid of elevation values, it returns a single elevation for a single coordinate pair. The query is simple: provide a latitude, longitude, dataset name, and your API key, and the API responds with the elevation at that point.
https://portal.opentopography.org/API/v1/elevation?longitude=-104.985462&latitude=39.739232&dataset=USGS30m&API_Key=YOUR_KEY
When Is a Point Query Better Than a DEM?
Downloading a DEM is the right tool when you need spatially continuous terrain data. But for many common tasks, retrieving and processing a raster is unnecessary overhead. The Point Elevation API is a better fit when you need to:
- Look up elevations at a list of addresses or GPS waypoints. The point API lets you query each location directly without downloading and processing a series of raster tiles. Daily query limits apply - see the API documentation for current limits.
- Add elevation context to a dataset. Researchers and developers who need to enrich tabular data (e.g. field survey records, wildlife observation logs, infrastructure inventories) with elevation values can do so with a simple API call per record.
- Compare elevations across multiple datasets for the same location. Because the point API supports many different datasets, you can query the same coordinate across all of them to understand how different data sources characterize a location's terrain.
- Build lightweight applications. Web apps or scripts that need elevation data on demand can call the point API without managing raster downloads or local storage.
Many Datasets, One Endpoint
The Point Elevation API provides access to numerous global and regional elevation datasets through a single REST API endpoint. These range from well-known global products like the Copernicus DEM (COP30, COP90), SRTM, and NASADEM, to regional datasets with higher resolution or specialized coverage:
| Dataset | Coverage | Resolution |
|---|---|---|
| COP30 / COP90 | Global | 30m / 90m |
| SRTM GL1 / GL3 | Global | 30m / 90m |
| NASADEM | Global | 30m |
| AW3D30 | Global | 30m |
| GEDTM | Global | 30m |
| SRTM15Plus / GEBCO | Global (ocean + land) | 500m |
| GEDI L3 | Global (~52S to ~52N) | 1km |
| USGS 10m / 30m | USA/North America | 10m / 30m |
| Canada MRDEM | Canada | 30m |
| LINZ DSM / DTM | New Zealand | 1m |
| ANADEM | South America | 30m |
| EU DTM | Europe | 30m |
| ArcticDEM | Arctic | 2m / 10m / 32m |
| REMA | Antarctica | 2m / 10m / 32m |
API queries are fast and lightweight.
Vertical Datums: Why They Matter and How We Help
One of the most important - and frequently overlooked - aspects of elevation data is the vertical datum: the reference surface from which elevation is measured. Different datasets use different vertical reference systems, and comparing elevations across datasets without accounting for these differences can introduce significant errors.
There are two broad categories of vertical reference:
- Geoid-based (orthometric) heights measure elevation relative to an equipotential surface of Earth's gravity field - the geoid - which closely approximates mean sea level. Common geoids used in global elevation datasets include EGM96 and EGM2008. Regional datums like NAVD88 (used by USGS products in the contiguous US), CGVD2013 (Canada), and NZVD2016 (New Zealand) are also geoid-based but are tied to locally refined geoid models.
- Ellipsoidal heights measure elevation relative to a mathematical ellipsoid - most commonly the WGS84 ellipsoid used by GPS. These heights are not referenced to sea level and can differ from geoid-based heights by tens of meters depending on location.
The difference between geoid and ellipsoid heights at a given point - known as the geoid undulation - is not constant. It varies from roughly -100 m to +90 m across the globe. This means that for the same location, two datasets using different vertical references can report elevations that appear to disagree by a significant margin, even when both datasets are accurate.
The Point Elevation API returns not just the elevation value but also the vertical coordinate reference system (CRS) for each dataset, in both EPSG codes and Well-Known Text (WKT) formats. This allows users to understand the datum of any returned value and, when needed, apply the appropriate transformation to put elevations from multiple sources on a common reference surface.
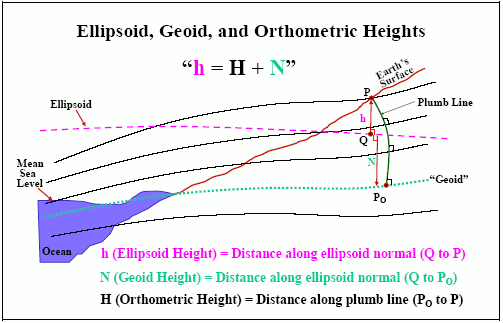
Figure depicting the differences between geoids, ellipsoids, and orthometric heights for a given point on the Earth's surface. The geoid is the gravitational equipotential surface that best approximates mean sea level. An orthometric height is the vertical distance measured along a plumb line from the geoid up to a point on the Earth's surface — in other words, what most people think of as 'elevation above sea level'. Image source: https://vdatum.noaa.gov/docs/datums.html
Here is a summary of the vertical datums used across the available datasets:
| Vertical Datum | Datasets |
|---|---|
| EGM2008 Geoid | COP30, COP90, EU DTM, GEDTM, ANADEM |
| EGM96 Geoid | SRTM GL1/GL3, NASADEM, AW3D30, SRTM15Plus |
| WGS84 Ellipsoid | ArcticDEM, REMA, GEDI L3, AW3D30-E, SRTM GL1 Ellipsoidal |
| NAVD88 | USGS 10m, USGS 30m |
| CGVD2013 | Canada MRDEM |
| NZVD2016 | LINZ DSM, LINZ DTM |
| Mean Sea Level | GEBCO IceTopo / SubIceTopo |
Not All Elevations Are the Same: DSMs, DTMs, and Sensor Differences
Even for the same point on the ground - and using the same vertical datum - different datasets can return noticeably different elevation values. This is a feature, not a bug: it reflects real differences in what each dataset is measuring and how it was collected.
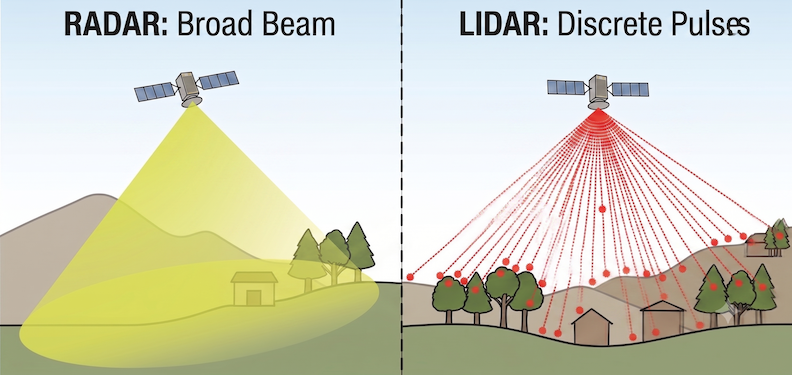
Sensor type matters. Many global datasets, including SRTM and NASADEM, were collected using radar interferometry (SAR). Radar signals partially penetrate vegetation and tend to reflect off the top of tree canopies rather than bare ground. Lidar-derived datasets use laser pulses with smaller footprints that can often penetrate the canopy to isolate ground returns, producing much more accurate bare-earth elevations in vegetated terrain. A third approach, optical stereo photogrammetry, derives elevation by analyzing two or more overlapping images taken from slightly different viewing angles. ArcticDEM and REMA - the elevation models of the Arctic and Antarctica, respectively - are both built from optical stereo imagery collected by commercial satellites such as WorldView and GeoEye. Like radar, stereo photogrammetry measures the surface rather than bare ground, but unlike radar it requires clear, sunlit conditions - a workable constraint in the polar regions where these datasets are most useful.
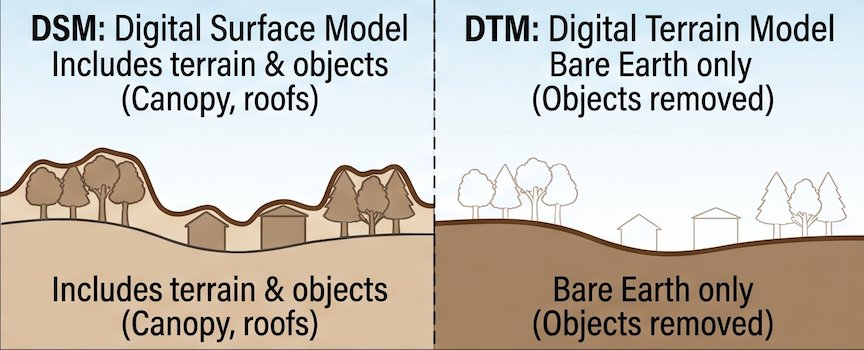
Surface model vs. terrain model. A Digital Surface Model (DSM) represents the elevation of the first surface the sensor "sees" - including buildings, trees, and other above-ground features. A Digital Terrain Model (DTM) represents the bare earth beneath those features. For a point in an urban area or a forest, a DSM and a DTM for the same location can differ by many meters. The New Zealand and Canadian datasets provide both a DSM and DTM, making this difference directly observable. The EU DTM, GEDTM30, and ANADEM products are terrain models by design, while the Copernicus and SRTM-based products are effectively surface models in vegetated and urban areas since they are derived from SAR.
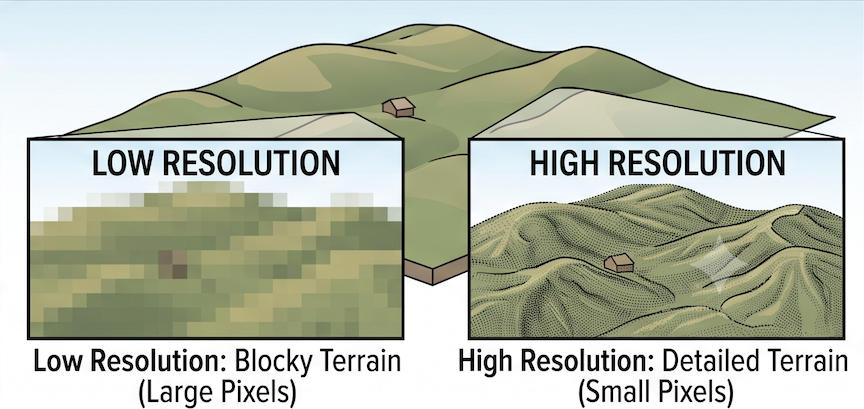
Resolution affects sampled values. A 30m DEM and a 1m DEM at the same coordinate are not sampling the same thing - the coarser product averages over a much larger area, smoothing out local relief. In complex terrain, the difference can be substantial.
Querying the same coordinate across multiple datasets in the Point Elevation API provides a direct, practical view of how all of these factors interact at any given location.
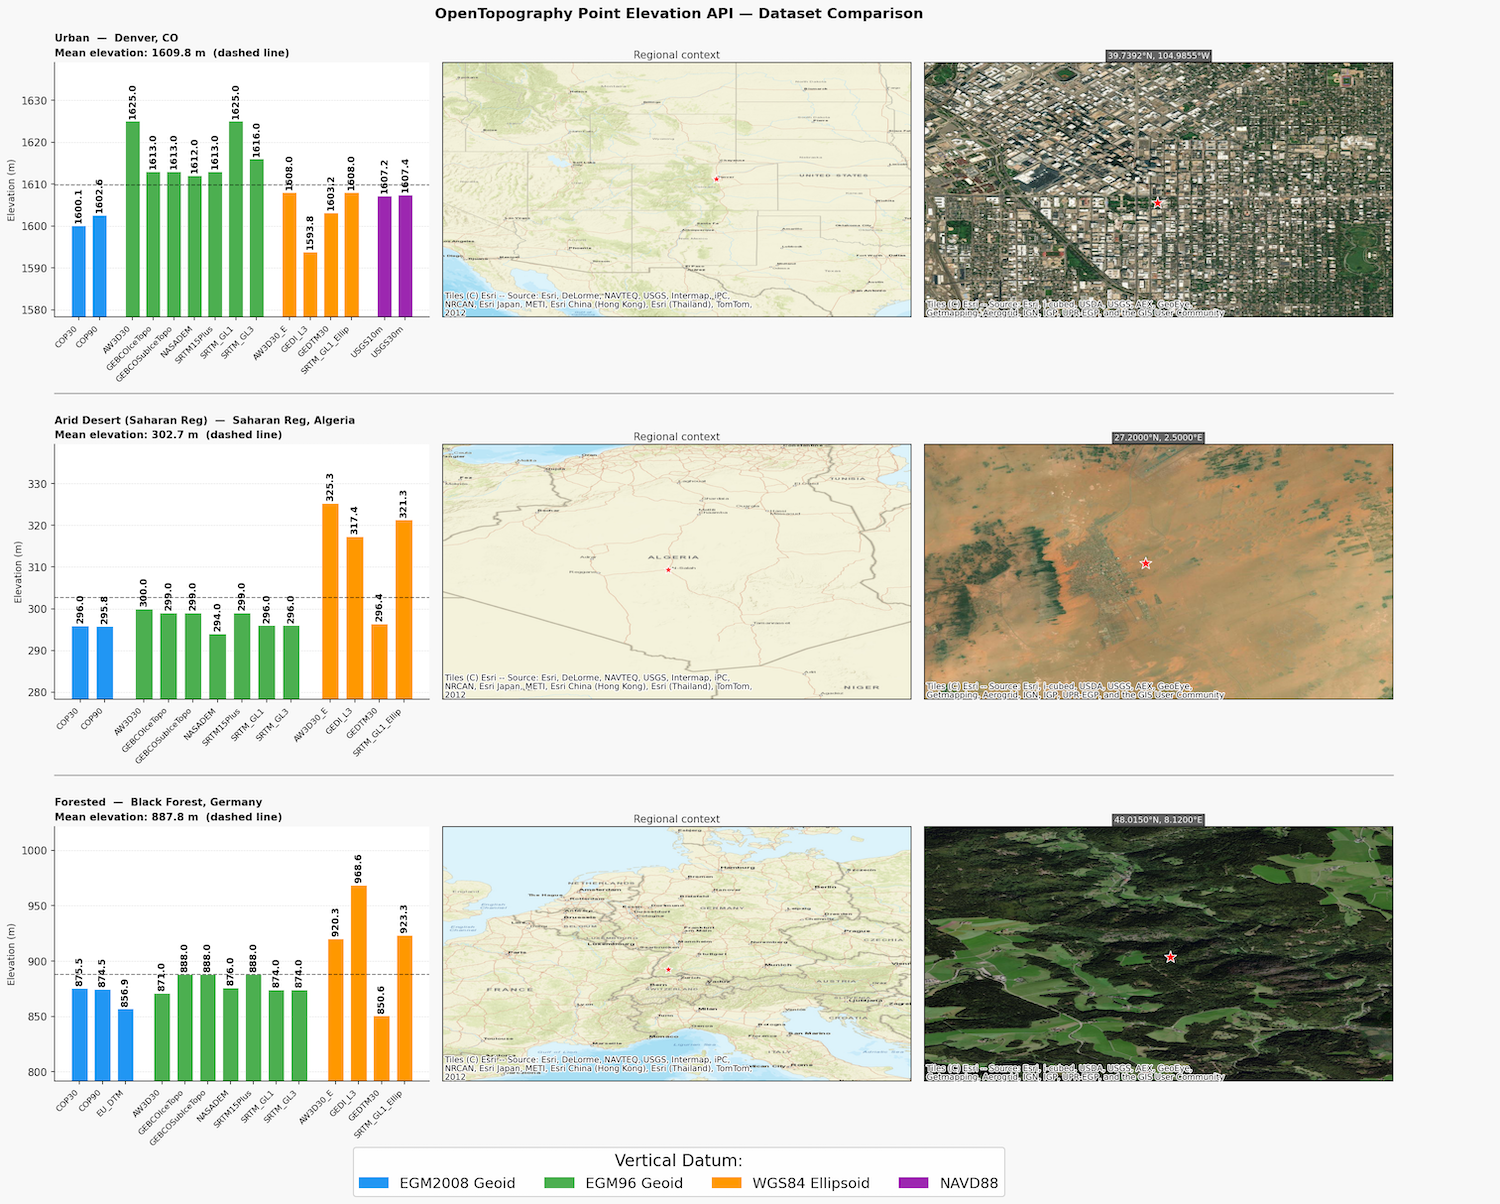
Elevation returned by each OpenTopography dataset for three representative locations: an urban area (top row: Denver, CO), an arid desert (middle row: Saharan Reg, Algeria), and a forested region (bottom row: Black Forest, Germany). Bars are color-coded by vertical datum. The middle column shows the regional location of the query point; the right column shows zoomed-in satellite imagery. Differences across datasets reflect differences between sensor type (lidar vs. radar), DSM vs. DTM, spatial resolutions, and vertical reference systems.
Getting Started
The Point Elevation API is available to all OpenTopography users with a free API key. To request your free API key, create a free OpenTopography account, and then visit your OpenTopography user profile to obtain your key.
A Jupyter notebook is available in OpenTopography's Github that demonstrates how to use the point elevation API, and how to reproduce the plot above.
Full documentation and a list of supported datasets are available on the OpenTopography API page. Users can also explore and test the API directly in the browser via the interactive API documentation.